


Schedule a Call Back


India- A Global Manufacturing Hub?
 Articles
- Mar 11,25
Manufacturing thrives on scale — the bigger, the better. Even for major economies like the USA and China, this requires strong infrastructure: land, water, power, steel production, manpower, roads, railways, and ports, opines, R Jayaraman, Head-Capstone Projects, Bhavan's SPJIMR.
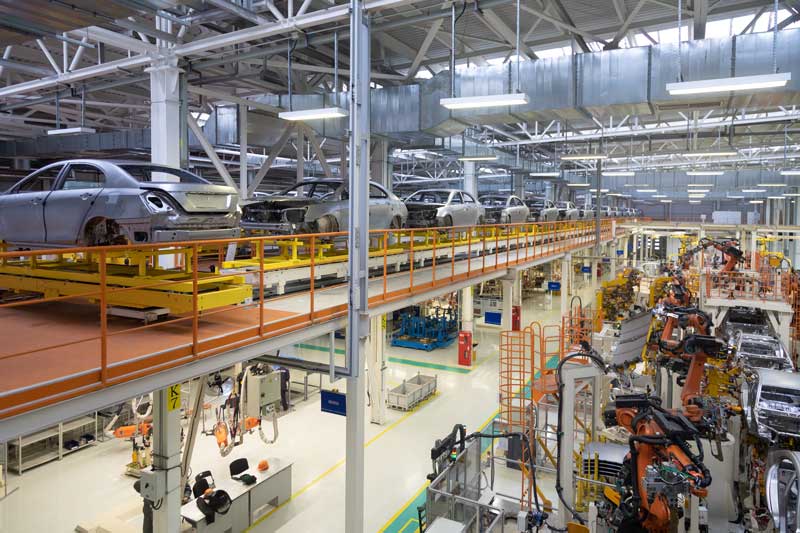
India's potential to become a global manufacturing hub is a critical question under the government's vision of an Atmanirbhar Bharat. The government is committed to positioning India as a major manufacturing destination, a role that China has dominated for years.
China's rise as a manufacturing powerhouse was driven by Western companies seeking lower labour costs, along with China's proven competence and capability in delivering high-quality goods and services. Today, China leads in global manufacturing, producing over a billion tonnes of crude steel annually and accounting for nearly 33 per cent of global passenger car production.
India aims to replicate this success by leveraging its workforce, policy support, and infrastructure development to attract global investments and strengthen its manufacturing sector (table 1).
|
Year |
Passenger cars production worldwide (mvpa) |
China (mvpa) |
||||||
|
2008 |
71 |
9.3 |
||||||
|
2015 |
91 |
24.6 |
||||||
|
2020 |
78 |
25.3 |
||||||
|
2023 |
94 |
26.1 |
||||||
|
|
Table 1: Comparison of production of automobiles |
|
|
|
|
|
||
Compared with these numbers, India is currently achieving about 125 mtpa of crude steel and about 5 mvpa of passenger cars. India has a long way to go. Not just that, the global hub numbers are truly mind boggling. What characterises as a ‘global manufacturing hub (GMH)’? For comparisons, the total output of China’s manufacturing sector was about $4.9 trillion in 2022, whereas India was a comparatively low less than $1 trillion. (see figure 1)

China’s numbers
are double that of US that have been achieved in the last twenty years or so. It
is incredible and serves as a beacon of hope for those who want to emulate.
Dimensions
of a GMH
There are at
least five dimensions which a country should be aware of, to become a GMH.
Quantity of goods: A billion tonnes of crude steel, at least 10 to 20 mvpa of
passenger cars, about 5 to 10 mvpa of commercial vehicles, about 30 to 35 mtpa
of aluminium, between 1,000 to 2,000 GW of installed electric power generation
capacity — and the list goes on. The point is that the numbers are big, the
investments needed to create such capacities are also big, and the capital
required is neither easy to imagine nor easy to secure.
For example, setting up a one mtpa integrated steel plant takes about ?50 billion. It could be less if done on a brownfield site. If this is accepted, then we will need about ?500 billion per annum to create a capacity of 10 mtpa, which has been achieved in India in the past. To create the capacity of 300 mtpa targeted by GOI by 2030, from the current level of 180 mtpa, an additional capital investment of about ?1000 billion per year will be needed for the next six years. That’s a lot — and only for one industry.
Similar amounts are needed in other basic industries like mining, aluminium,
electric power, railways, and other infrastructure. This scale of effort
requires recognising the importance of project management and construction
management. Just imagine — to build this quantum of industrial structures, we
will need at least 400,000 personnel per annum. And this is for just one
industry. As of now, there is an acute shortage of skilled manpower for
construction projects in India.
To get an idea of the magnitude of the task in becoming a GMH in terms of quantum of output, we list five key industries outputs in India and China. (table 2)
|
Good |
India |
China |
Remarks |
|
Crude steel |
124.45 million tonnes |
1,013 billion metric tonnes |
China’s output is 9 times that of India |
|
Electricity |
1,624 billion units |
8,389,000 billion units |
China’s output is about 5,000 times that of India |
|
Roads |
6.331 miliion kms |
5.44 million kms |
More than China |
|
Civil airports |
44 |
254 |
China has 6 times as many airports as india |
|
Iron Ore production |
254 million tonnes |
968 million tonnes |
China produces about 4 times as much as India |
|
Length of Railway lines |
68,000 kms |
155,000 kms |
China has about 2.2 times that of India |
|
Table 2: Comparison
of some key metrics related to manufacturing in China and India |
|||
One can easily guess the enormity of the task of becoming a GMH.
·
Availability
of basic infrastructure factors
Manufacturing thrives on scale — the bigger, the better. Even for major economies like the USA and China, this requires strong infrastructure: land, water, power, steel production, manpower, roads, railways, and ports. As shown in Figure 1, the gap between India and the USA is smaller than between India and China. Therefore, comparing India with the USA offers a more realistic benchmark and greater hope for progress. See (table 3)
|
Good |
India |
USA |
|
Crude steel (million tonnes per annum) |
125 |
81 |
|
Electricity (billion units per annum) |
1,624 |
4,230,723 |
|
Roads (million kms) |
6.331 |
6.64 |
|
Civil airports (numbers) |
44 |
5,193 |
|
Iron Ore production (million tonnes per annum) |
254 |
48 |
|
Length of Railway lines (kms) |
68,000 |
149,000 |
|
Table 3:
Comparison of infrastructure factors for manufacturing – India and the USA
(all above figures are for the year 2022) |
||
The USA numbers are
not too far way from those of India. However, to get the correct perspective,
let’s look at the per capita picture. The total output value of the
manufacturing GDP in India and USA for 2022 were: $470 million
and $2,730 million (with China at 4,648 $ million). This is
summarised in the table below:
|
GDP data
for 2022 |
$ Million |
per cent Manufacturing |
Mfg GDP million $ |
|
India |
3,385 |
13.9 |
470 |
|
USA |
26,000 |
10.5 |
2,730 |
|
China |
17,880 |
26.0 |
4,648 |
The productivity
of the key infrastructure variables per capita are shown in table 4:
|
Good |
India |
USA |
USA/India
|
|
Electricity productivity ($ million per B
Units) |
0.29 |
0.001 |
0.002 |
|
Roads productivity ($ million per M KM) |
74.85 |
411.14 |
5.493 |
|
Cargo airports productivity ($ million per airport) |
47.39 |
91.00 |
1.920 |
|
Railway productivity ($ million per km) |
0.01 |
0.02 |
2.629 |
|
Table 4:
Comparison of productivity of infrastructure for manufacturing – India and
the USA (productivity = Manufacturing GDP in $ million / units of good) |
|||
Barring
electricity, the USA uses its infra far more effectively than India. The
effectiveness is reflected in the amount of each infra ‘consumed’ to produce a
unit of manufacturing output. This analysis has the flaws of aggregate
analysis, but, directionally, it indicates that India can improve its infrastructure
usage to catch up with the USA in the manufacturing sector. Hence, the GOI
could look more closely at these figures and find out if this route can be
applied to some extent to reach the GMH goal of India.
·
Land
availability
Manufacturing requires substantial land — for factories, inventory storage,
housing supply chain participants, mining, mineral production, and in India’s
case, agricultural farming. While agriculture isn’t classified as
manufacturing, it plays a significant role in India’s land-use analysis
compared to China and the USA.
India’s land area is 1.597 million square km, far smaller than China’s 9.6
million square km and the USA’s 9.53 million square km. This puts India at a
clear disadvantage. In terms of agricultural land use, India dedicates 60 per
cent, compared to 44 per cent in the USA and just 10 per cent in China. As a
result, the land available for industry and other purposes is approximately 8.6
million square km for China, 5.33 million square km for the USA, and only 0.64
million square km for India.
The GDP productivity per square km of land area for these three countries is
shown in Table 5:
|
Item |
China |
USA |
India |
|
Manufacturing GDP in 2022 ($ million) |
4,648 |
2,730 |
470 |
|
Total Land Area ( Million skm) |
9.60 |
9.53 |
1.60 |
|
per
cent Used for agricuture |
10 |
44 |
60 |
|
per
cent available for other uses |
90 |
56 |
40 |
|
Land area available for other uses, Million skm |
8.64 |
5.34 |
0.64 |
|
Land productivity (GDP $ million per M skm) |
538 |
512 |
736 |
|
Table 5:
Land productivity and future prospects for using it for GMH in India |
|||
India’s land usage for manufacturing is more productive than in China or the
USA, but its limited available land leaves few options: either boost current
productivity or convert agricultural land into industrial use.
·
Logistics
Manufacturing heavily depends on transportation, involving the movement of raw
materials, components, and finished products. Globally, logistics costs range
from 8 per cent to 10 per cent of production costs, but in India, it exceeds 10
per cent. Initiatives like PMGSS aim to reduce this. Logistics relies on land,
roads, railways, and ports, though India still mainly uses road, rail, and sea
routes, with limited pipeline infrastructure.
For manufacturing, logistics splits into domestic and export channels.
Domestic logistics depends on roads and railways, while exports face additional
complexities like customs and international practices. In the last decade,
India’s transport infrastructure has improved significantly, though productivity
data tells a more detailed story, as shown in Table 6.
|
Item |
China |
USA |
India |
|
GDP in
2022 ($ million) |
4,648 |
2,730 |
470 |
|
Lemgth of
Railway Lines (km) |
1,55,000 |
1,49,000 |
68,000 |
|
Length of
Roads (Million km) |
5.44 |
6.64 |
6.33 |
|
Railway
productivity ($ million per km) |
0.03 |
0.02 |
0.01 |
|
Roads
productivity ($ million per km) |
854 |
411 |
74 |
|
Table 6:
Railway and Roads productivity |
|||
Here’s a clearer and more concise version:
India’s logistics productivity parameters are significantly lower than those
of the USA, posing a major bottleneck for the country’s manufacturing
ambitions. Poor transport infrastructure and weak last-mile connectivity to
ports and commercial centers hinder efficiency. The Pradhan Mantri Gati Shakti
Scheme (PMGSS) addresses these issues through a coordinated, multi-level
approach, but this remains a key area for improvement.
·
Ports
Ports are essential for any nation aiming to become a global manufacturing hub
(GMH). Efficient inland connectivity to ports directly impacts overall
logistics performance, but sea transport remains slow due to global chokepoints
like the Suez Canal, Panama Canal, and South China Sea. In India, domestic
factories rely on ports for both exports and internal movement — for instance,
Gujarat’s cement plants use sea routes for distribution.
However, the lack of point-to-point connectivity at ports results in
multiple loadings, inspections, and delays. Despite these inefficiencies, sea and
rail transport remain the most cost-effective options for bulk goods, typically
moving products into warehouses before final distribution. Table 7 highlights
the productivity comparison of ports in India, China, and the USA.
|
Item |
China |
USA |
India |
|
GDP in
2022 ($ million) |
4,648 |
2,730 |
470 |
|
Number of
ports (Major, except India) |
34 |
25 |
229 |
|
Traffic
handled (million tonnes) |
15,680 |
1,325 |
16,700 |
|
Traffic
productivity ($ million per million tonnes handled at the ports) |
0.30 |
2.06 |
0.03 |
|
Ports
productivity ($ million per port) |
136.71 |
109.20 |
2.05 |
|
Table 7:
Productivity of Ports |
|||
Note:
India has 229 ports, with 12 classified as major, handling only 54 per cent
of the country’s cargo. Unlike the USA and China, where only major ports manage
most of the cargo, India’s overall port productivity remains low, even when
considering only its major ports.
Port productivity reflects cargo-handling capacity, processing speed, and
ease of booking and release procedures — all critical for efficient trade. Two
key productivity measures stand out: "traffic productivity,"
indicating the volume of goods moved, and revenue generated per port, with
higher figures signaling better infrastructure.
India falls short on both measures, highlighting the urgent need for more
efficient and world-class port facilities. A recent Government of India report
revealed a 47 per cent increase in India’s coastline length, offering greater
potential for developing new, high-capacity ports.
Conclusion
India still has a long way to go to become a global manufacturing hub,
requiring significant improvement across key areas. While the financial
investment needed is massive, the country has ample manpower and ingenuity.
Success will depend on determined leadership at the national and state levels,
along with skilled project managers, engineers, and workers. The past decade
has proven that India has the potential to achieve this goal.
-----------------------------------------------------------------------
About the
author:
R Jayaraman is
the Head-Capstone Projects, Bhavan's S P Jain Institute of Management &
Research (SPJIMR). He has worked in several capacities, including Tata Steel,
for over 30 years. He has authored over 60 papers in academic and techno
economic journals in India and abroad. Jayaraman is a qualified and trained
Malcolm Baldrige and EFQM Business Model Lead Assessor.
----------------------------------------------------
Photo credit: Freepik
Related Stories
Smart Manufacturing

Gautam Solar earns EcoVadis Silver Medal for sustainable manufacturing practices
Gautam Solar has received the EcoVadis Silver Medal with a score of 78/100, placing it among the Top 15 per cent of companies assessed for sustainability performance.
Read moreAuto & Auto Components

N A N MagneTech to establish India’s first integrated NdFeB magnet facility
N A N MagneTech will establish India’s first fully integrated high-performance NdFeB magnet manufacturing facility in Andhra Pradesh with a Rs 12.5 billion Phase I investment.
Read moreOther Industrial Products
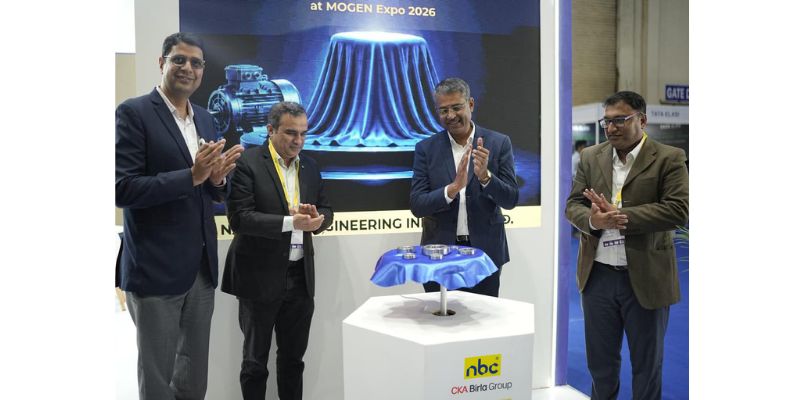
NBC Bearings launches low noise EMQ bearings for electric motor applications
NBC Bearings has launched its Low Noise, Low Vibration Electric Motor Quality (EMQ) Bearings at Mogen Expo, Bengaluru, designed to improve performance in electric motors, EVs and precision equipment..
Read moreRelated Products
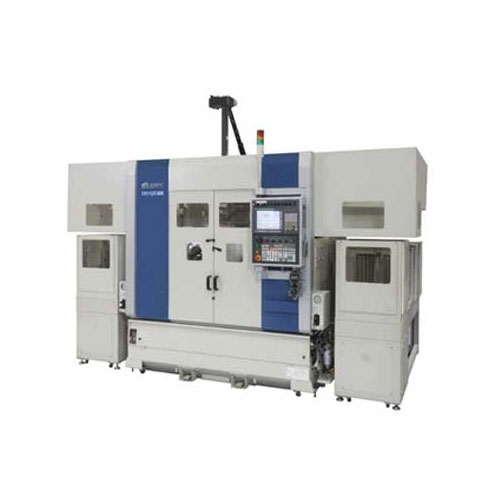
Compact Fmc - Motorum 3048tg With Fs2512
INDUSTRIAL AUTOMATION & TECHNOLOGY CONSULTANCY
Meiban Engineering Technologies Pvt Ltd offers a wide range of Compact FMC - Motorum 3048TG with FS2512.

Digital Colony Counter
INDUSTRIAL AUTOMATION & TECHNOLOGY CONSULTANCY
Rising Sun Enterprises supplies digital colony counter.

Robotic Welding SPM
INDUSTRIAL AUTOMATION & TECHNOLOGY CONSULTANCY
Primo Automation Systems Pvt. Ltd. manufactures, supplies and exports robotic welding SPM.
latest News
Subscribe to iNoW
For Industry News on WhatsApp, Give a Miss Call on: +91 84228 74016